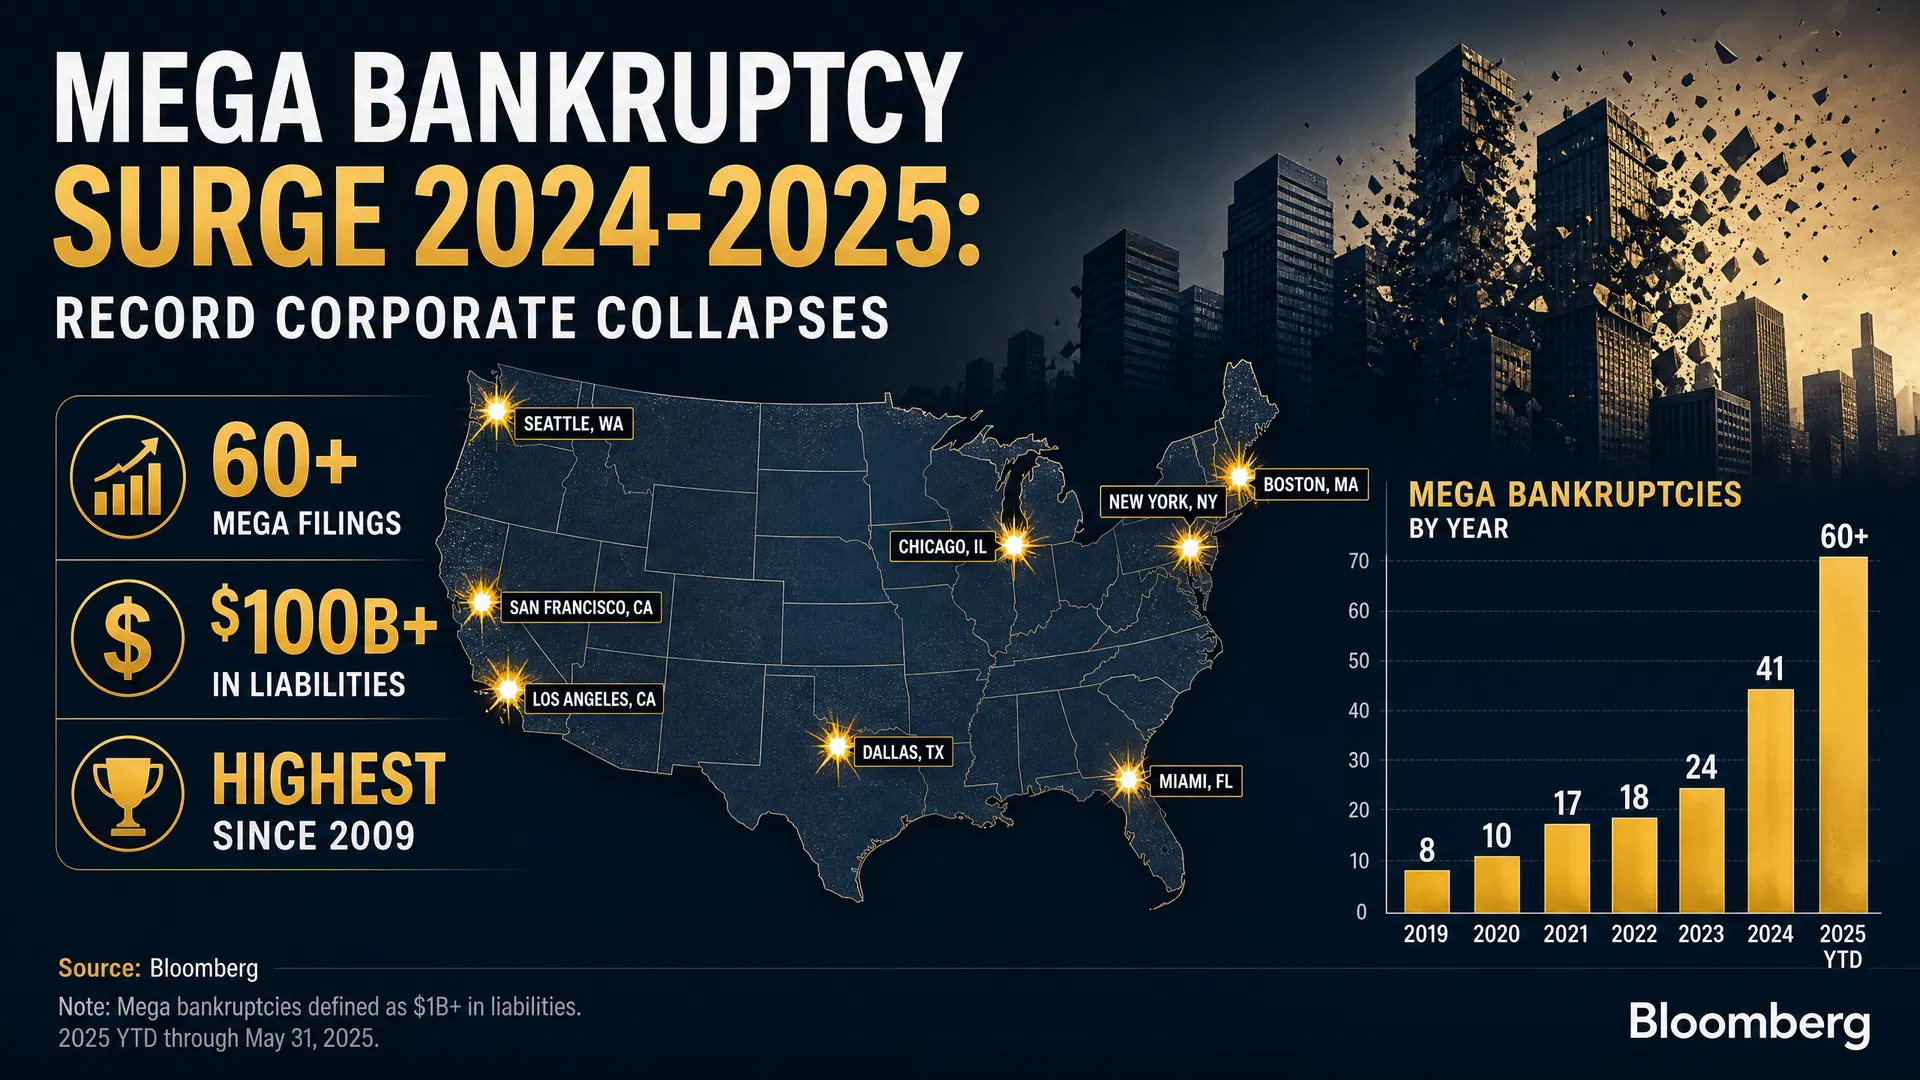
In the first half of 2025, there were more billion-dollar bankruptcies than in any comparable period since the COVID-19 outbreak in 2020. Seventeen companies with assets exceeding $1 billion filed for Chapter 11 protection in just six months. The stock market was near all-time highs. Unemployment remained relatively low. The Federal Reserve had begun cutting interest rates. By conventional measures, the economy was not in crisis.
Yet corporate America was failing at a near-crisis pace. The paradox is not as puzzling as it appears. The 2024-2025 mega bankruptcy surge is the product of forces that were set in motion years earlier: the legacy of cheap money that allowed overleveraged companies to survive longer than their fundamentals warranted, the hangover of private equity debt placed on balance sheets during the low-rate era, and the new pressures of trade policy uncertainty and regulatory change that have hit specific industries with particular force.
This article uses data from Cornerstone Research, S&P Global Market Intelligence, and the Private Equity Stakeholder Project to map the surge, identify its causes, and assess what the data predicts for 2026.
A Surge Without a Recession
The defining feature of the 2024-2025 mega bankruptcy wave is its disconnect from the macroeconomic cycle. Previous surges in large corporate bankruptcies have been closely associated with economic recessions: the dot-com bust of 2001-2002, the financial crisis of 2008-2009, and the COVID-19 shock of 2020. The current surge is occurring in an environment where GDP growth is positive, unemployment is below 5%, and consumer spending remains resilient.
The following table documents the scale of the current surge relative to historical benchmarks:
| Period | Large Company Filings (>$100M assets) | Context |
|---|---|---|
| 2005-2024 annual average | 81 | Historical baseline |
| 12 months ending H1 2025 | 117 | 44% above historical average |
| H1 2025 alone | 17 mega bankruptcies (>$1B) | Highest since COVID-19 outbreak in 2020 |
| Historical annual average (mega) | 23 per year | Cornerstone Research baseline |
| 12 months ending H1 2025 (mega) | 32 mega bankruptcies | 39% above historical average |
Source: Cornerstone Research, "Trends in Large Corporate Bankruptcy and Financial Distress: Midyear 2025 Update," September 2025.
The 44% elevation above the historical annual average for large company filings is a striking figure. It suggests that the current wave is not a temporary fluctuation but a structural shift in the corporate distress landscape. Cornerstone Research's analysis identifies several contributing factors, including the expiration of pandemic-era forbearance arrangements, the maturation of debt issued during the low-rate era, and the specific pressures facing manufacturing and retail sectors.
Defining the "Mega Bankruptcy"
The term "mega bankruptcy" refers to Chapter 11 filings by companies with assets exceeding $1 billion at the time of filing. This threshold is significant for several reasons. Cases of this scale are almost always filed in one of a handful of specialized bankruptcy courts (primarily Delaware and the Southern District of Texas — a concentration explored in depth in our companion article on forum shopping). They involve complex capital structures, multiple creditor classes, and reorganization processes that can take years to complete. And they attract the attention of institutional investors, restructuring professionals, and regulators in ways that smaller cases do not.
The historical record of mega bankruptcies provides essential context for understanding the current surge. The following table documents the largest public company bankruptcies from the post-financial-crisis era (2009-2011), drawn from the SEC's Public Company Bankruptcy Cases Opened and Monitored dataset:
| Year | Company | Assets at Filing | Filing District | Notes |
|---|---|---|---|---|
| 2009 | CIT Group | $71.0 billion | S.D. New York | 5th-largest bankruptcy in U.S. history at the time |
| 2009 | General Growth Properties | $29.6 billion | S.D. New York | Largest real estate bankruptcy in U.S. history |
| 2009 | Nortel Networks | $11.6 billion | D. Delaware | Largest tech bankruptcy since WorldCom |
| 2009 | Smurfit-Stone Container | $7.9 billion | D. Delaware | Largest packaging company bankruptcy |
| 2010 | Palm Inc. | $1.1 billion | D. Delaware | Acquired by HP post-bankruptcy |
| 2011 | MF Global Holdings | $40.5 billion | S.D. New York | 8th-largest bankruptcy in U.S. history |
| 2011 | AMR Corporation (American Airlines) | $25.0 billion | S.D. New York | 24th-largest bankruptcy in U.S. history |
| 2011 | Eastman Kodak | $5.1 billion | S.D. New York | End of an American icon |
Sources: BankruptcyData.com; Jones Day "Year in Bankruptcy: 2011"; SEC EDGAR filings.
The 2009-2011 wave, which produced 211 public company filings in 2009 alone, was driven by the financial crisis and the collapse of credit markets. The current wave is different in character: it is driven not by a credit market collapse but by the accumulated consequences of years of financial engineering, combined with sector-specific operational pressures.
The Numbers: 44% Above Historical Average
The Cornerstone Research midyear 2025 update provides the most comprehensive available analysis of the current surge. The firm's data shows that the 12-month period ending in the first half of 2025 produced 117 large company filings (assets >$100 million) — 44% above the 2005-2024 historical annual average of 81. [^1]
The mega bankruptcy segment (assets >$1 billion) showed an even more pronounced elevation: 32 filings in the 12-month period, compared to a historical average of 23 per year. The first half of 2025 alone produced 17 mega bankruptcies — the highest semi-annual total since the COVID-19 outbreak in 2020.
The Pandemic Suppression Effect
Understanding the current surge requires understanding the pandemic suppression effect. The COVID-19 pandemic, paradoxically, produced the lowest bankruptcy filing rates in decades. Federal stimulus programs — the Paycheck Protection Program, enhanced unemployment benefits, eviction moratoriums, and Federal Reserve asset purchases — injected trillions of dollars into the economy and provided a lifeline to businesses that would otherwise have failed.
The result was a cohort of "zombie companies" — businesses that were fundamentally unviable but were kept alive by cheap money and government support. As stimulus programs expired, interest rates rose, and consumer behavior normalized, these companies faced the reckoning that had been deferred. The 2024-2025 surge is, in significant part, the delayed consequence of the pandemic-era suppression.
Which Industries Are Failing?
The current mega bankruptcy wave is not evenly distributed across the economy. Manufacturing has emerged as the sector most affected, accounting for the highest share of mega bankruptcies in the 12-month period ending H1 2025. [^1] The following table summarizes the industry distribution:
| Industry Sector | Share of Mega Bankruptcies | Key Driver of Distress |
|---|---|---|
| Manufacturing | ~30% (highest share) | Regulatory/policy landscape (67% cited this) |
| Services | ~25% | Labor costs, consumer behavior shifts |
| Retail & Consumer | ~20% | E-commerce competition, post-pandemic normalization |
| Healthcare | ~12% | Reimbursement pressures, labor costs |
| Real Estate | ~8% | Rising interest rates, office market disruption |
| Energy | ~5% | Commodity price volatility |
Source: Cornerstone Research, September 2025.
The manufacturing sector's dominance is particularly striking. Cornerstone Research found that 67% of manufacturing mega-bankruptcy filers cited the regulatory and policy landscape as a key driver of their financial distress — a figure that reflects the impact of trade policy uncertainty, tariff changes, and environmental regulations on capital-intensive industries. [^1]
The retail and consumer sector, while accounting for a smaller share of mega bankruptcies than manufacturing, produced some of the most high-profile individual cases: Red Lobster (May 2024), Big Lots (September 2024), Tupperware (September 2024), and Spirit Airlines (November 2024). These cases attracted significant media attention because of their consumer-facing brands and the visible closure of stores and routes.
The Private Equity Factor
Private equity's role in the current mega bankruptcy wave is substantial and well-documented. According to the Private Equity Stakeholder Project, PE firms were involved in 54% of the 35 largest U.S. bankruptcies in 2025. [^2] This figure reflects the accumulated consequences of the leveraged buyout boom of the 2010s, when historically low interest rates enabled PE firms to load portfolio companies with debt at unprecedented scale.
The mechanism is familiar from the retail apocalypse analysis: PE firms acquire companies using borrowed money, place the debt on the acquired company's balance sheet, and extract fees and dividends during the ownership period. When interest rates rise and the debt becomes more expensive to service, or when the business faces operational headwinds, the company lacks the financial resilience to adapt.
The PE involvement rate of 54% in the largest bankruptcies is not uniform across sectors. It is highest in retail and consumer (where the pattern is most extensively documented) and in healthcare (where PE ownership of hospitals, physician practices, and other healthcare businesses has grown substantially over the past decade). The manufacturing sector's PE involvement rate is lower, reflecting the capital-intensive nature of manufacturing businesses that makes them less attractive LBO targets.
The New Playbook: Liability Management Transactions
One of the most significant developments in the corporate distress landscape is the proliferation of Liability Management Transactions (LMTs) — financial restructuring techniques that allow companies to address debt problems outside of formal bankruptcy proceedings. As noted in our companion article on investor protection, LMTs reached record levels in 2024-2025.
The 46 LMTs completed in 2024 and 27 in the first half of 2025 represent a fundamental shift in how large companies manage financial distress. [^1] Rather than filing for bankruptcy — which triggers the automatic stay, requires disclosure, and subjects the company to court oversight — companies increasingly use LMTs to restructure debt through private negotiations with their largest creditors.
LMTs can take many forms: debt exchanges that swap existing bonds for new securities at lower face value, "uptier" transactions that elevate certain creditors' priority at the expense of others, and asset transfers that move valuable collateral to new entities. Critics argue that LMTs often benefit the company's equity sponsors and largest creditors at the expense of smaller creditors and that they lack the transparency and fairness protections of the formal bankruptcy process.
The rise of LMTs means that the formal bankruptcy statistics understate the true scale of corporate financial distress. For every mega bankruptcy that appears in the Cornerstone Research data, there are multiple companies that have undergone significant debt restructuring through LMTs without filing for court protection.
What the Data Predicts for 2026
The forward-looking indicators suggest that the mega bankruptcy surge is likely to continue into 2026, though potentially at a somewhat reduced pace. Several factors support this assessment.
First, the pipeline of distressed companies remains substantial. S&P Global Market Intelligence data shows that the 2025 pace of large corporate bankruptcies is the highest since 2010, and the factors driving the surge — high debt loads, rising interest rates, and sector-specific pressures — have not been resolved. [^3]
Second, the maturation of debt issued during the low-rate era will continue to create refinancing pressure. Companies that issued bonds at 3-4% interest rates in 2020-2021 face the prospect of refinancing at 7-8% rates when those bonds mature. For companies with high debt loads, this refinancing wall can be insurmountable.
Third, the regulatory and policy environment remains uncertain. The manufacturing sector's high rate of distress is partly attributable to trade policy changes that have disrupted supply chains and increased input costs. If trade policy uncertainty persists or intensifies, manufacturing bankruptcies are likely to remain elevated.
The most likely scenario for 2026 is a gradual normalization — a decline from the elevated levels of 2024-2025 toward the historical average — as the cohort of zombie companies created during the pandemic era is worked through the system. But the structural factors that produced the surge (PE leverage, interest rate sensitivity, and sector-specific disruption) are not going away, and the next wave of corporate distress is likely already forming in the balance sheets of companies that are currently managing to service their debt but will face increasing difficulty as conditions evolve.
If your business is facing financial distress or you are a creditor in a large corporate bankruptcy, the attorneys in our directory can help. Find a bankruptcy attorney in your state or learn more about business bankruptcy options.
For related data journalism, see our analysis of the retail apocalypse and private equity debt, the 2023 regional banking crisis, investor protection in public company bankruptcies, and why mega bankruptcies happen in Delaware or Texas.
References
[^1]: Cornerstone Research. "Trends in Large Corporate Bankruptcy and Financial Distress: Midyear 2025 Update." September 2025. https://www.cornerstone.com/insights/reports/trends-in-large-corporate-bankruptcy-and-financial-distress-midyear-2025-update/
[^2]: Private Equity Stakeholder Project. "Private Equity Bankruptcy Tracker." February 2026. https://pestakeholder.org/reports/private-equity-bankruptcy-tracker/
[^3]: S&P Global Market Intelligence. "U.S. Bankruptcy Filings Drop for Private Equity-Backed Companies in 2025." January 2026. https://www.spglobal.com/market-intelligence/en/news-insights/articles/2026/1/us-bankruptcy-filings-drop-for-private-equity-backed-companies-in-2025-96404421
[^4]: U.S. Courts, Administrative Office. Bankruptcy Filings Statistics, 2018–2025. https://www.uscourts.gov/data-news/reports/statistical-reports/bankruptcy-filings-statistics
[^5]: American Bankruptcy Institute. Bankruptcy Statistics. https://www.abi.org/newsroom/bankruptcy-statistics
[^6]: SEC Public Company Bankruptcy Cases Opened and Monitored. Data.gov. https://catalog.data.gov/dataset/public-company-bankruptcy-cases-opened-and-monitored